Store Stock Redistribution supports different calculation types to identify the items that need to be redistributed to other stores.
The Manual Redistribution calculation type calculates the sales demand until the end of season, lifecycle, or calculation horizon for the items across stores and warehouses. Furthermore, the system calculates the current variant availability to identify broken variants. This calculation type does not classify locations into locations with demand or supply.
The Retail Item Variant Availability by Location page lets you determine manually how the variants shall be redistributed among the stores.
Calculation concept
This calculation type differentiates between two calculation approaches:
- Items without an assigned Lifecycle Curve
- Items with an assigned Lifecycle Curve.
Those approaches define how the expected sales quantity until the calculation horizon is calculated.
Items without an assigned Lifecycle Curve
For these items the calculation is based on the Average Sales Quantity from the calculation start date until today.
Calculation steps:
- Calculation of the Average Sales Quantity for each Item-Variant-Location combination for a defined time period (the Start Date in the Redistribution Replenishment Journal and the current date).
- Calculation of number of days until end of time period (End Date in Redistribution Replenishment Journal and current date).
- Calculation of Demand until End Date (Average Sales Quantity * Days until End Date).
- Calculation of Effective Inventory at End Date (current Effective Inventory minus Demand until End Date).
Items with an assigned Lifecycle Curve
For these items the calculation is based on the assigned Lifecycle Curve and the Lifecycle Starting Date.
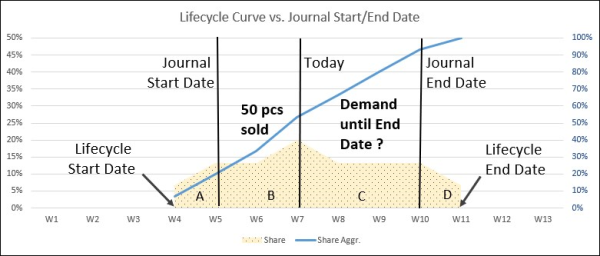
The above chart shows an item's lifecycle. The lifecycle starts in week 4 (introduction of product) and ends in week 11. Our Redistribution Replenishment Journal was run with a Journal Start Date in week 5 and an Journal End Date in week 10. The current date is in week 7. The yellow area shows the (expected) sales behavior of the item during its lifecycle - there is a slow start with an increase until week 7. Later, the sales will slowly decrease and finally, in week 10 and 11, drop significantly.
In the calculation the sold quantity is calculated within the calculation horizon (Journal Start Date until Journal End Date). The lifecycle is applied to understand, in which phase of the lifecycle the item is and what can be expect to be sold until the end of the calculation horizon (Journal End Date).
Calculation steps:
- Calculation of sold quantity between Journal Start Date and current date (area B in the chart).
In the example: 50 pcs.
- Calculation of the percentage share of the area B of the total Lifecycle.
In other words: the sum of the percentage shares of areas A+B+C+D is 100 %. What is the percentage share of B? - Calculation of the percentage share of the area C of the total Lifecycle.
This area represents the time from the current day until the end of the calculation horizon. This is the time that is still left to sell the item. - Calculation of Demand until End Date.
Formula: sold quantity (area B) divided by percentage share of area B multiplied by percentage share of area C.
This is the quantity that is expected to be sold until the Journal End Date, based on the lifecycle and sold quantity until today.
Click here for information on how to set up Lifecycle Curves.
Setup fields on Redist. Template
| Field | Description |
|---|---|
| Replenishment Type | This field specifies whether the Replenishment Template is to be used for Store Stock Redistribution, or for creating Purchase Orders or Transfer Orders. The selection Redistribution is used for Store Stock Redistribution. |
| Redistribution Calculation Type | This field specifies the type, how the system calculates the Redist. Stock and Redist. Demand. The available values are:
|
| Redistribution Strategy | This field specifies the strategy, how the system calculates the trips between stores with Redist. Stock and Redist. Demand. The available values are:
More information can be found here: Redist. Strategies. |
| Redistribution Warehouse Stock | This field is used for Store Stock Redistribution and defines how available stock in the Warehouse is treated. The available values are:
More information can be found here: Warehouse in Redistribution. |
| Linked Lifecycle Planning Worksheet | This field shows the Lifecycle Planning Worksheet name that is linked to this template. The items to be calculated in the journal will be taken from the Linked Lifecycle Planning Worksheet. This field is assigned from Lifecycle Worksheets which can be accessed via the Name lookup in Lifecycle Planning Worksheet.
More information can be found here: Lifecycle Planning Worksheet. |
| Template is Linked with Store Capacity |
This field shows whether there is any Store Capacity line linked to this template. The items to be calculated in the journal will be taken from the linked Store Capacity line.
More information can be found here: Store Capacity |
| Season Code | This field specifies the Season Code that will be used to filter the items considered in the calculation. |
| Date Calculation Type | This field specifies whether the start date and end date will be entered manually or calculated based on a given date formula. |
| Start Date | This field specifies the start date to be used for store stock redistribution calculation. This is the starting date to be based on when calculating sales information such as Qty. Sold until Today, Sell Through % and Average Daily Sales. It is automatically assigned with the season's starting date if a Season Code is selected. This is used when the Date Calculation Type is Date. |
| End Date | This field specifies the end date to be used for store stock redistribution calculation. This is the ending date to be based on when calculating sales information such as Demand until End Date. It is automatically assigned with the season's ending date if a Season Code is selected. This is used when the Date Calculation Type is Date. |
| Start Date Formula | This field specifies the formula to calculate the start date for store stock redistribution calculation. This is used when the Date Calculation Type is Date Formula. |
| End Date Formula | This field specifies the formula to calculate the end date for store stock redistribution calculation. This is used when the Date Calculation Type is Date Formula. |
| Stockout % Above | Stockout % defines the ratio of out-of-stock item variants to the total number of item variants from all stores. Only items with Stockout % above the value defined in this field will be considered in the calculation. |
| Sell Through % Above | Sell Through % defines the ratio of total sold inventory of the item as of today to its total inventory as of start date. Only items with Sell Through % above the value defined in this field will be considered in the calculation. |
Filters on Redist. Template
In the Redist. Template you can set the filters you want to apply to the items considered in the calculation.
| Filter | Description |
|---|---|
| Vendor No. Filter | This field specifies a filter for the Vendor No. field of the items. An example is 1000 if you only want to select items from vendor number 1000. If you enter 1000..2000 the system will select all items from vendor number 1000 to 2000. |
| Item Division Code | This field specifies a filter for the Division Code field of the item. |
| Item Category Filter | This field specifies a filter for the Item Category Code field of the item. |
| Item Product Group Filter | This field specifies a filter for the Product Group Code field of the item. |
| Item No. Filter | This field specifies a filter for the item number. |
| Special Group Code Filter | This field specifies a filter for Special Groups. Only items in these Special Groups will be considered in the calculation. |
| Item Attribute Filter | This field specifies a filter for Attributes. |
| From Location Filter
To Location Filter |
This field specifies a filter for From Location and To Location. When Store Stock Redistribution calculates the inventory in the Locations, it classifies Locations into Supply Locations (=From Location Filter) and Demand Locations (=To Location Filter). When the Calculation Type Manual Redistribution is used, From Location Filter and To Location Filter always have the same value. This filter will set Locations to the status Excluded in Store Stock Redistribution when the Calculation Type Manual Redistribution is used. Locations that are filtered out will not appear in the Preview and Journal Lines. |
Calculation result
The calculation of Redist. Preview is initiated with the Add Items to Preview action on the Redistribution Replenishment Journal page.
When the preview is calculated, the Show Redist. Preview action opens the Redistribution Journal Preview page where you can view the calculated sales performance indicators (such as Sell Through %, Demand until End Date, etc) for the items across stores. The locations are not classified into locations with demand or supply, that is, the Redist. Stock and Redist. Demand are not automatically calculated by the system.
The system further calculates the current variant availability to identify broken variants. From the preview page, the Show Items Availability action, opens up the Retail Item Variant Availability by Location page, which enables you to manually determine how the variants shall be redistributed among the stores. If the journal is linked to a Store Capacity line, the Retail Item Variant Availability by Location page allows you to assign transfer quantities from warehouses to the store based on the capacity utilization of the store. For more information on how to manually assign Redist. Stock and Redist. Demand, please refer to Retail Item Variant Availability by Location.
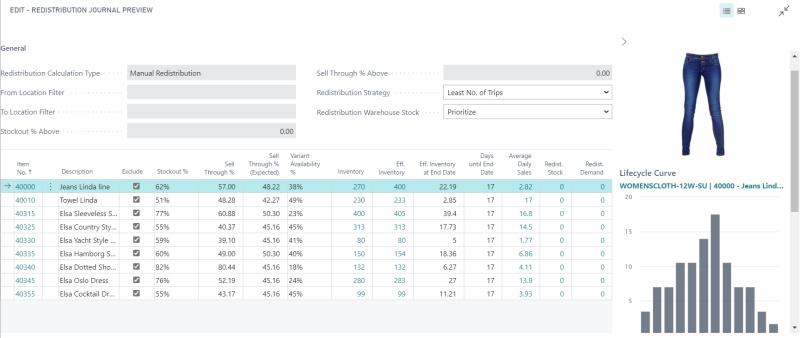
Fields on Redistribution Journal Preview
| Field | Description |
|---|---|
| Item No. | This field shows the Item Number. |
| Exclude | Items with this check box selected will be excluded from redistribution trips calculation. |
| Stockout % | This field shows the ratio of out-of-stock item variants to the total number of item variants from all stores. |
| Sell Through % | This field shows the ratio of total sold inventory of the item as of today to its total inventory as of start date. |
| Sell Through % (Expected) | This field shows the expected Sell Through % based on the start date, current date, and end date, as well as the lifecycle curve, if assigned to the item. |
| Inventory | This field shows the total inventory of the item. |
| Eff. Inventory | This field shows the total inventory of the item, considering also the Purchase Orders, Sales Orders, and Transfer Orders that have not been posted. |
| Eff. Inventory at End Date | This field shows the remaining effective inventory of the item on the end date. |
| Days until End Date | This field shows how many days are remaining from the current date until the end date. |
| Average Daily Sales | This field shows the calculated average daily sales of the item from the start date until the current date. |
| Redist. Stock | This field shows the total redistributable quantity of the item across all stores. |
| Redist. Demand | This field shows the total demand quantity of the item across all stores. |
Store Capacity information on Redistribution Journal Preview
The following fields are only shown if the replenishment journal is linked to a Store Capacity line. For more information, see How to: Assign Stock Transfer Based on Store Capacity.
| Field | Description |
|---|---|
| Capacity Goal | This field shows the store capacity limit for the items. |
| Actual Eff. Capacity | This field shows the actual used capacity based on the Eff. Inventory of the items, which may include the quantities from Sales, Purchase, or Transfer Orders, depending on the setup in the Effective Inventory FastTab, in Replenishment Setup. |
| Added Items (Capacity) | This field shows the capacity that will be added to the store location, based on the transfer quantities that have been assigned to the items. |
| New Eff. Capacity | This field shows the total of Actual Eff. Capacity and Added Items (Capacity). |
| Open to Add | This field shows the remaining available capacity that can be filled before reaching the store capacity limit. |
| Warehouse Inventory | This field shows the inventory of the item in the warehouse. |
| Store Inventory | This field shows the inventory of the item in the store. |
| Item Capacity Value | This field shows the space consumption per unit of the item (Base Unit of Measure) for any store. |
See Also
Redistribution Calculation Types